ISDS case map


Click on the dots on the map to explore ISDS cases or look at the list below


ISDS cases displayed on this map


Africa Asia Europe
Ampal-American vs. Egypt
Unión Fenosa vs. Egypt
Veolia vs. Egypt
Al-Kharafi vs. Libya
Carlyle vs. Morocco
Foresti vs. South Africa
Agro EcoEnergy vs. Tanzania
Total vs. Uganda
Border Timbers & Von Pezold vs. Zimbabwe
Bechtel, Enron and seven European banks vs. India
Vodafone vs. India
Churchill Mining vs. Indonesia
Newmont Mining vs. Indonesia
Khan Resources Inc. vs. Mongolia
Tethyan Copper vs. Pakistan
Fraport vs. Philippines
Hanocal & IPIC International vs. South Korea
Kingsgate vs. Thailand
ConocoPhillips & Perenco vs. Vietnam
Razvoj Golf & Elitech vs. Croatia
CME & Lauder vs. Czech Republic
Saluka vs. Czech Republic
Vermilion vs. France
Vattenfall vs. Germany I
Vattenfall vs. Germany II
Rockhopper vs. Italy
RWE vs. Netherlands
Eureko vs. Poland
Gabriel Resources vs. Romania
Micula vs.. Romania
Yukos vs. Russia
Achmea vs. Slovakia
Ascent Resources vs. Slovenia
NextEra vs. Spain
Latin America North America Pacific
Abaclat vs. Argentina

Azurix vs. Argentina

CMS Gas vs. Argentina

Aguas del Tunari vs. Bolivia

ADP International and Vinci Airports vs. Chile

Eco Oro vs. Colombia

Novartis vs. Colombia

Infinito Gold vs. Costa Rica

TCW vs. Dominican Republic

Chevron vs. Ecuador

Copper Mesa vs. Ecuador

Occidental Petroleum vs. Ecuador

Pac Rim vs. El Salvador

Kappes, Cassidy & Associates vs. Guatemala

RDC vs. Guatemala

Próspera vs. Honduras

Abengoa vs. Mexico

Access (Amway) vs. Mexico

Cargill vs. Mexico

Metalclad vs. Mexico

Renco vs. Peru

Philip Morris vs. Uruguay

ConocoPhilips vs. Venezuela

Crystallex vs. Venezuela
Eli Lilly vs. Canada

Ethyl vs. Canada

ExxonMobil and Murphy Oil vs. Canada

Lone Pine vs. Canada

TC Energy vs. United States
Philip Morris vs. Australia

Barrick Gold vs. Papua New Guinea


Key ISDS facts

  • Amount of ISDS cases: 1104 (2020)
  • Total claimed amount: $US 570 billion (2018)
  • Average amount claimed by investors: US$ 1.5 billion
  • Average amount awarded by tribunals: US$ 438 million
  • Largest award: US$ 50 billion (Yukos vs. Russia)
  • Results of decisions (on the merits): 61% in favour of investors (2019)
  • Most invoked treaty in ISDS arbitrations: Energy Charter Treaty (135 cases)
  • Investor legal costs on average: US$ 6.4 million
  • States legal costs on average: US$ 4.7 million
  • ISDS proceedings average length: 4 years and a half

(Source: UNCTAD, BIICL, SOMO)


Additional resources:

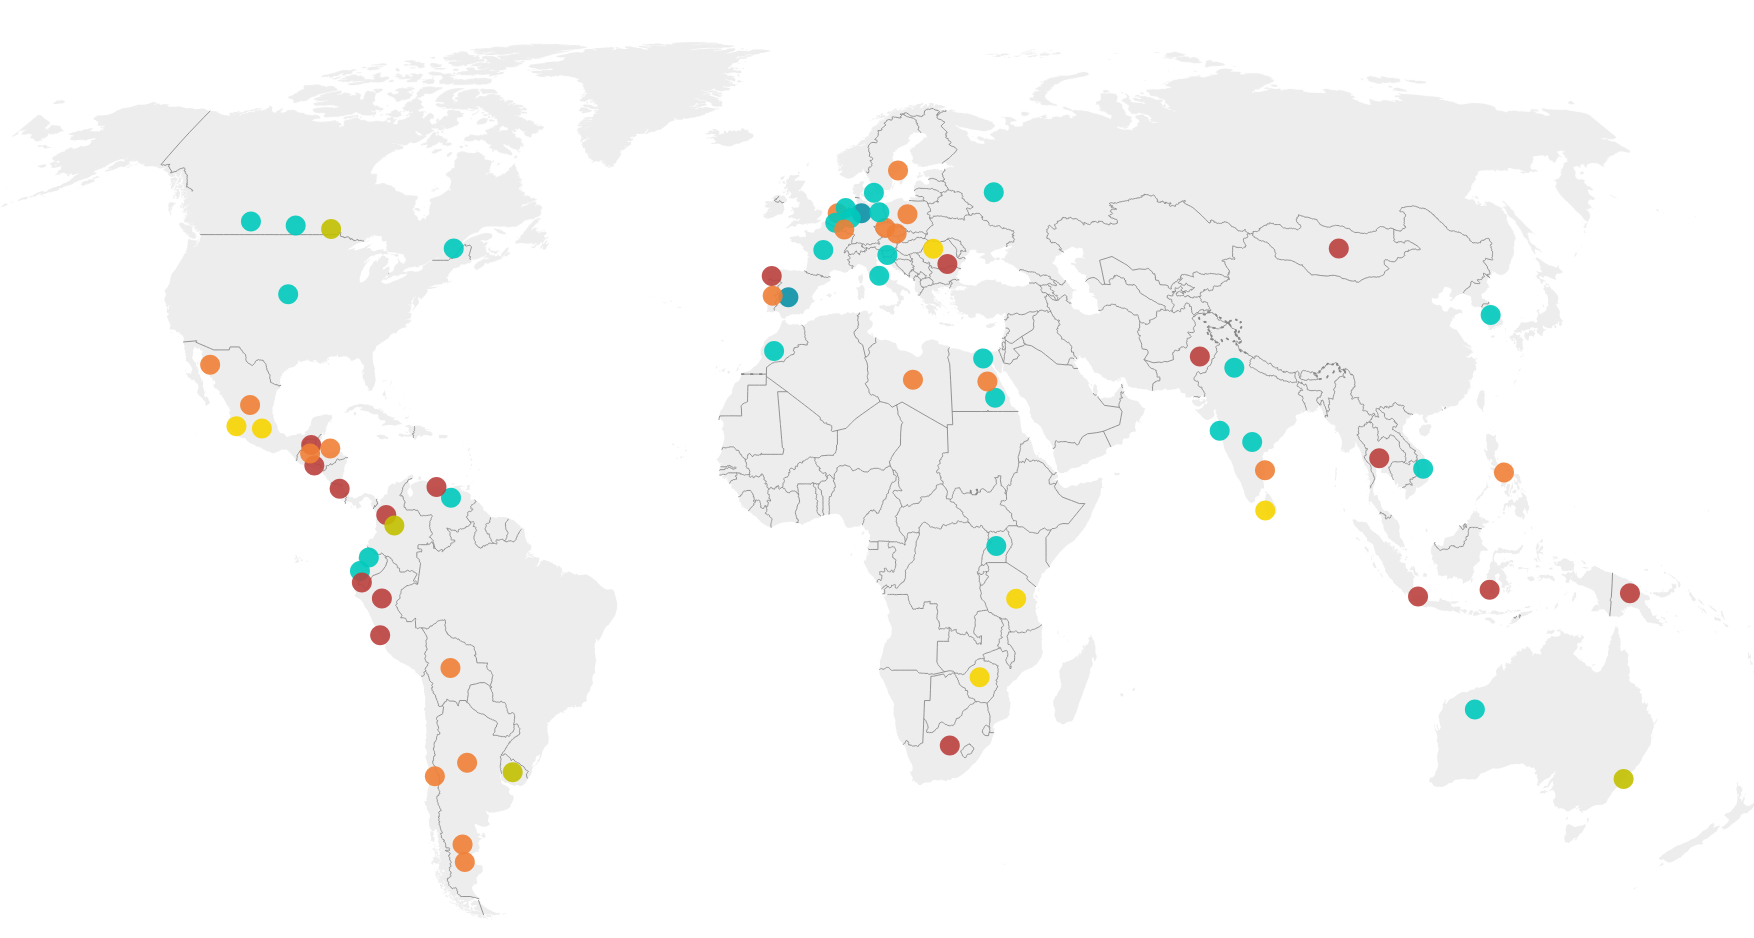
The ISDS case map was produced with the support of Friends of the Earth International.


  Fuente: bilaterals.org